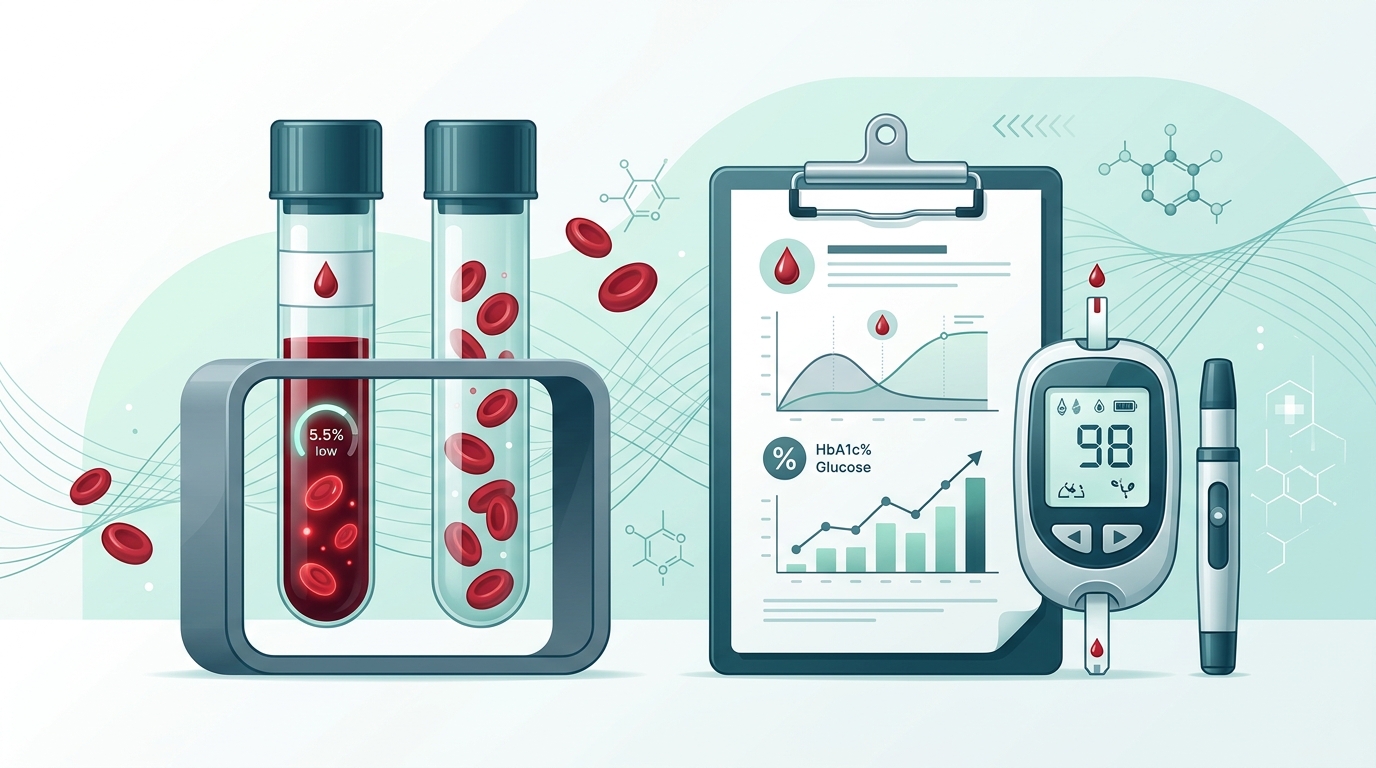
HbA1c Normal Range: Levels Chart, Meaning & How to Lower It
⚡ Fast Answer: Official HbA1c Reference Chart
| Clinical Category | HbA1c (%) | IFCC (mmol/mol) | Estimated Average Glucose (eAG) |
|---|---|---|---|
| Normal (Non-diabetic) | < 5.7% | < 39 mmol/mol | < 117 mg/dL (< 6.5 mmol/L) |
| Prediabetes (Increased Risk) | 5.7% – 6.4% | 39 – 47 mmol/mol | 117 – 137 mg/dL (6.5 – 7.6 mmol/L) |
| Diabetes Diagnosis Criterion | ≥ 6.5% | ≥ 48 mmol/mol | ≥ 140 mg/dL (≥ 7.8 mmol/L) |
| Standard Target for Most Adults with Diabetes | < 7.0% | < 53 mmol/mol | < 154 mg/dL (< 8.6 mmol/L) |
What Is Hemoglobin A1c (HbA1c)?
Hemoglobin A1c (HbA1c) measures the percentage of hemoglobin in your red blood cells that is coated with glucose (a process called glycation). Because red blood cells survive in circulation for about 120 days, an A1c blood test reveals your average blood glucose level over the preceding 2 to 3 months.
How HbA1c Differs from Daily Fingerstick Checks
A standard fingerstick or continuous glucose monitor (CGM) gives you a real-time snapshot of your blood sugar at that exact second. In contrast, HbA1c is a weighted 90-day biological average: approximately 50% of the value reflects the past 30 days, while the remaining 50% accounts for months 2 and 3.
Converting HbA1c to Estimated Average Glucose (eAG)
Under the landmark ADAG (A1c-Derived Average Glucose) clinical trial, doctors translate A1c percentages into everyday blood sugar numbers:
- HbA1c 6.0% (42 mmol/mol) ≈ 126 mg/dL (7.0 mmol/L) 24-hour average.
- HbA1c 7.0% (53 mmol/mol) ≈ 154 mg/dL (8.6 mmol/L) average.
- HbA1c 8.0% (64 mmol/mol) ≈ 183 mg/dL (10.2 mmol/L) average.
Calculate your specific numbers with our free HbA1c to eAG Calculator or switch units via the Blood Glucose Unit Converter.
Common Reasons for an Elevated HbA1c
An A1c above 5.7% indicates persistent glycemic excursions above optimal thresholds. Frequent underlying contributors include:
- Underlying Insulin Resistance: Muscles and liver cells become less responsive to insulin signals. Check your resistance level with our HOMA-IR Calculator and read What to Do If Your HOMA-IR Is High.
- Unnoticed Postprandial Spikes: High-glycemic meals can surge blood sugar 1–2 hours after eating. Learn target values in our guide on blood sugar 2 hours after meals.
- Poor Sleep and Chronic Cortisol: Sleep deprivation elevates stress hormones, causing morning glucose elevations.
- Red Blood Cell Turnover Variations: Anemia or hemoglobin variants can artificially raise or lower test results.
5 Proven Steps to Safely Lower Your HbA1c
Reducing HbA1c by just 1.0% significantly decreases long-term microvascular and cardiovascular risks:
- 1. Take a 10–15 Minute Post-Meal Walk: Skeletal muscle contractions pull glucose directly from the bloodstream via non-insulin GLUT4 pathways.
- 2. Adopt Food Sequencing: Eating non-starchy vegetables and protein before carbohydrates blunts post-meal glycemic spikes by up to 40%.
- 3. Optimize Meal Timing & Overnight Fasting: Restricting your eating window to 10–12 hours (early time-restricted eating) and avoiding late-night carbs lowers both overnight fasting glucose and overall glycated hemoglobin. Discover clinical protocols in our guide to meal timing and intermittent fasting for blood sugar.
- 4. Consistent 7–8 Hour Sleep: Restorative sleep restores overnight insulin sensitivity.
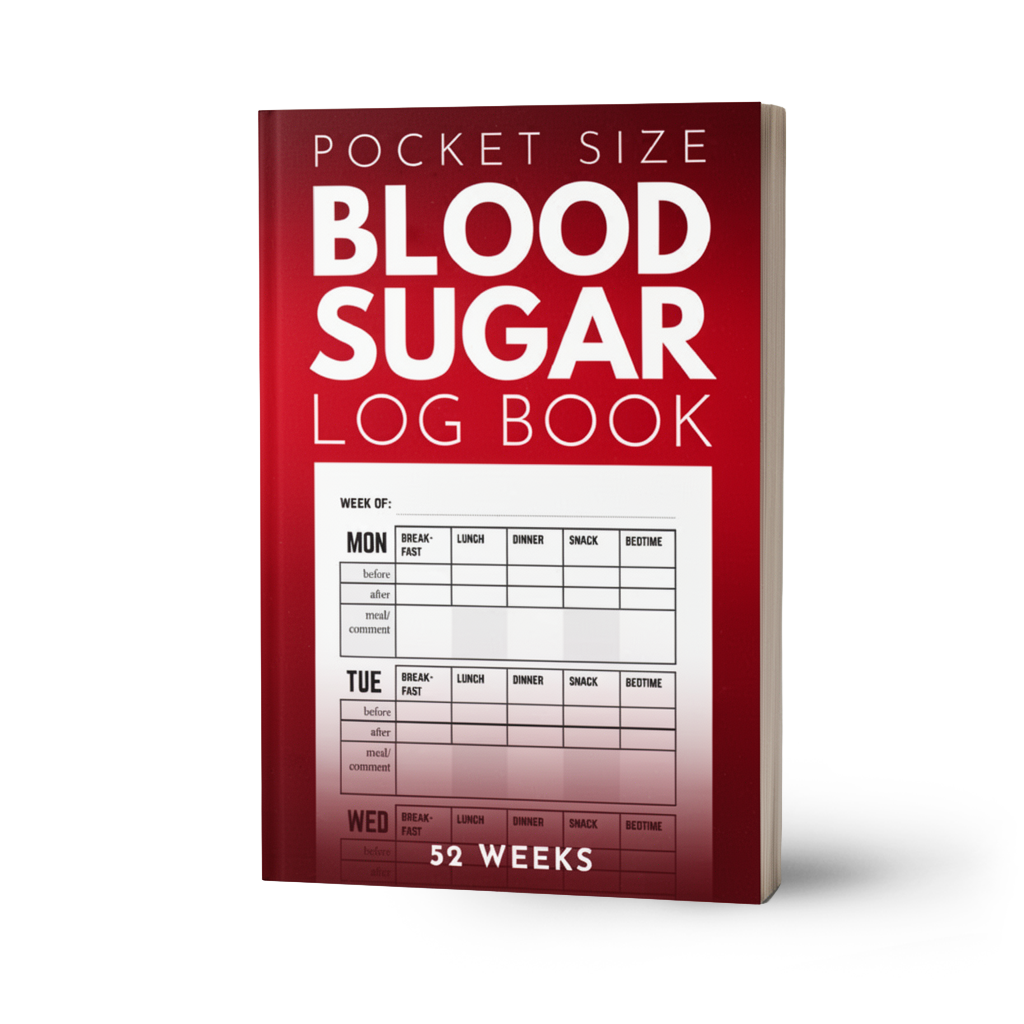
- 5. Paired Glucose Tracking: Logging paired pre- and post-meal readings in a physical journal isolates culprit meals and accelerates clinical adjustments.
Frequently Asked Questions (FAQ)
Track Daily Readings to Optimize Your A1c
The Overspire Pocket Diabetes Log Book gives you dedicated spaces for pre- and post-meal checks, insulin dosages, and notes to share with your physician at your next HbA1c review.
 View Pocket Diabetes Log Book on Amazon (4.5★)