High Fasting Insulin: Causes, Reference Ranges & How to Lower It
⚡ Quick 30-Second Answer
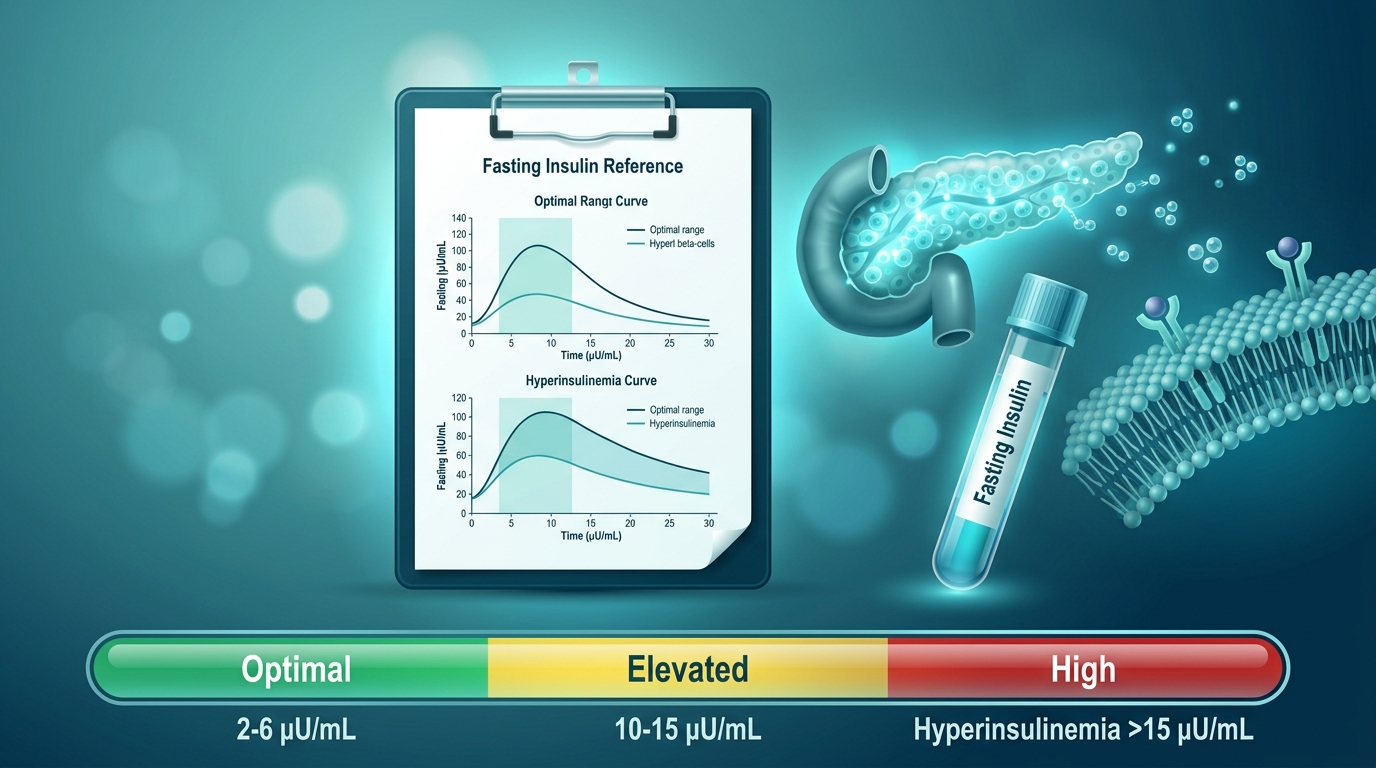
A fasting insulin level above 10–12 µU/mL (even though laboratory reference sheets often list up to 24.9 µU/mL as "normal") indicates compensatory hyperinsulinemia: your pancreas must oversecrete insulin to force glucose into resistant cells. Elevated fasting insulin is the earliest red flag for insulin resistance, appearing 5 to 10 years before fasting glucose begins to climb. It is fully reversible through meal sequencing, time-restricted eating, and targeted muscle activation.
Fasting Insulin Clinical Reference Ranges Table
Standard laboratory reference intervals are extremely wide (2.6 – 24.9 µU/mL). Modern metabolic health guidelines distinguish optimal physiological levels from early metabolic dysfunction:
| Fasting Insulin Level | Value in pmol/L | Metabolic Status | Clinical Interpretation |
|---|---|---|---|
| < 6.0 µU/mL | < 42 pmol/L | Optimal | Excellent cellular insulin sensitivity. Minimal cardiometabolic risk. |
| 6.0 – 9.9 µU/mL | 42 – 69 pmol/L | Normal | Healthy physiological baseline. No excessive pancreatic workload. |
| 10.0 – 14.9 µU/mL | 70 – 104 pmol/L | Borderline / Early Resistance | Compensatory hyperinsulinemia. Cells are starting to resist insulin; ideal window for intervention. |
| ≥ 15.0 µU/mL | ≥ 105 pmol/L | Confirmed Insulin Resistance | Marked hyperinsulinemia. Pancreas under significant strain; strong association with fatty liver and prediabetes risk. |
Calculate your exact insulin resistance index
If you have both your fasting glucose and fasting insulin lab numbers, evaluate your cellular sensitivity instantly using our validated HOMA-IR tool.
Open Free HOMA-IR Calculator →The Iceberg Phenomenon: Normal Blood Sugar with High Insulin
Most annual physicals check only fasting blood glucose. However, blood sugar is merely the tip of the metabolic iceberg. When muscle and liver cells resist insulin, the beta cells in your pancreas compensate by producing 2x to 4x more insulin to keep plasma glucose in check.
During this compensatory phase, fasting blood sugar can remain completely normal (e.g. 85–95 mg/dL) for a decade. Measuring fasting insulin directly or calculating the HOMA-IR index uncovers metabolic resistance years before type 2 diabetes develops.
The 4 Primary Drivers of Elevated Basal Insulin
1. Visceral & Hepatic Fat Accumulation
Ectopic fat in the liver impairs its ability to suppress hepatic gluconeogenesis, requiring higher basal insulin concentrations.
2. Continuous Grazing and Lack of Overnight Fasting
Eating every 2–3 hours prevents insulin levels from returning to their low resting baseline, keeping the body in constant fat-storage mode.
3. Refined Carbohydrates & Liquid Fructose
Sugary drinks, fruit juices, and refined grains rapidly enter the portal vein, driving immediate hepatic de novo lipogenesis.
4. Chronic Cortisol & Sleep Fragmentation
Sleeping fewer than 6 hours elevates nocturnal cortisol and sympathetic tone, blunting peripheral insulin receptor sensitivity.
4 Evidence-Based Steps to Lower Fasting Insulin
Implement a 12–14 Hour Overnight Fasting Window
Finishing dinner by 7:30 PM and eating breakfast after 8:30 AM gives the liver and pancreas an extended recovery window to clear circulating basal insulin.
Adopt the "Fiber First" Food Sequencing Rule
Consuming raw salad or non-starchy vegetables before proteins and carbohydrates flattens post-meal glucose and insulin spikes by up to 40%.
Engage Muscle GLUT4 Transporters with Movement
Resistance training (weightlifting, bodyweight) and a 10–15 minute walk right after meals clears glucose directly into skeletal muscle without requiring extra insulin.
Eliminate Liquid Sugars & Boost Dietary Magnesium
Replace juices and sodas with water and green tea. Increase magnesium-rich foods (pumpkin seeds, spinach, avocados) to improve insulin receptor affinity.
Related Clinical Tools for Tracking
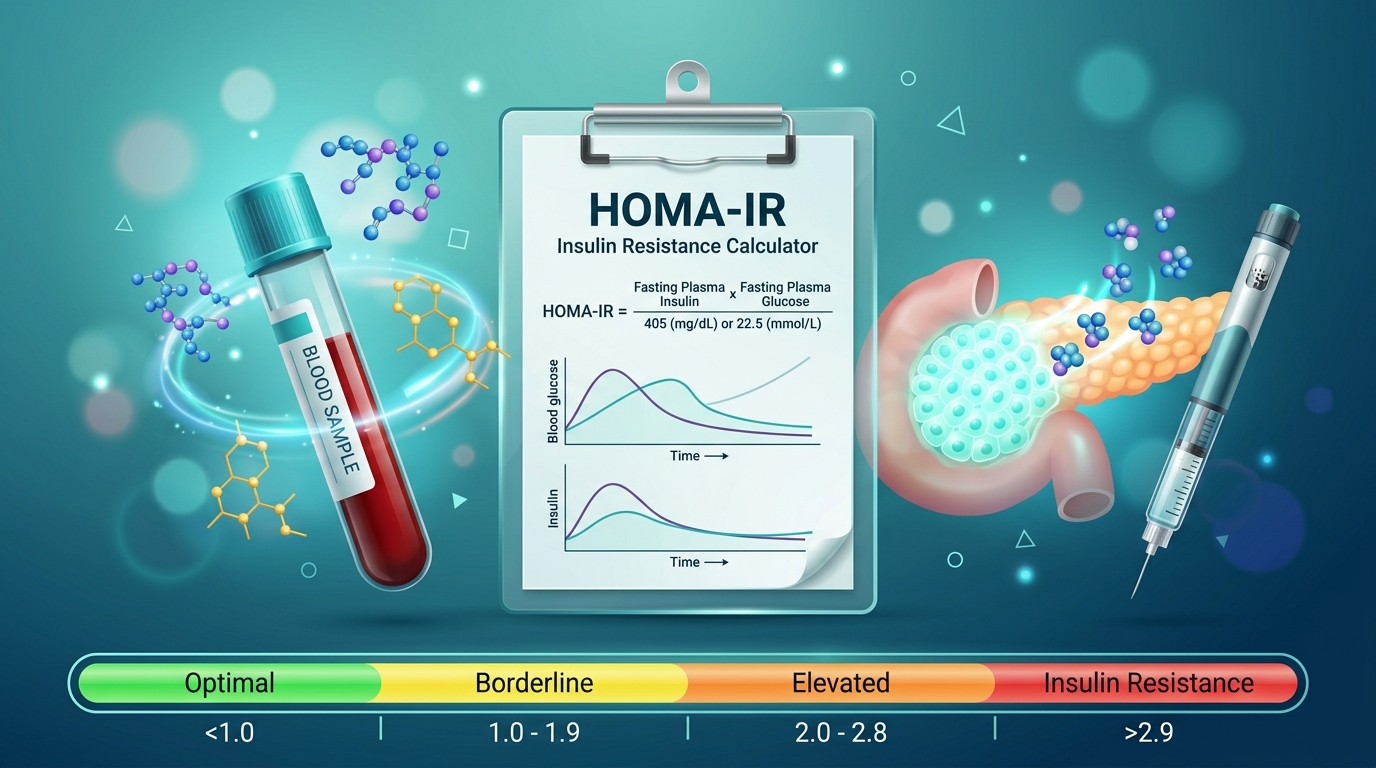
HOMA-IR Calculator Online
Calculate your insulin resistance score and pancreatic beta-cell function.
Open tool →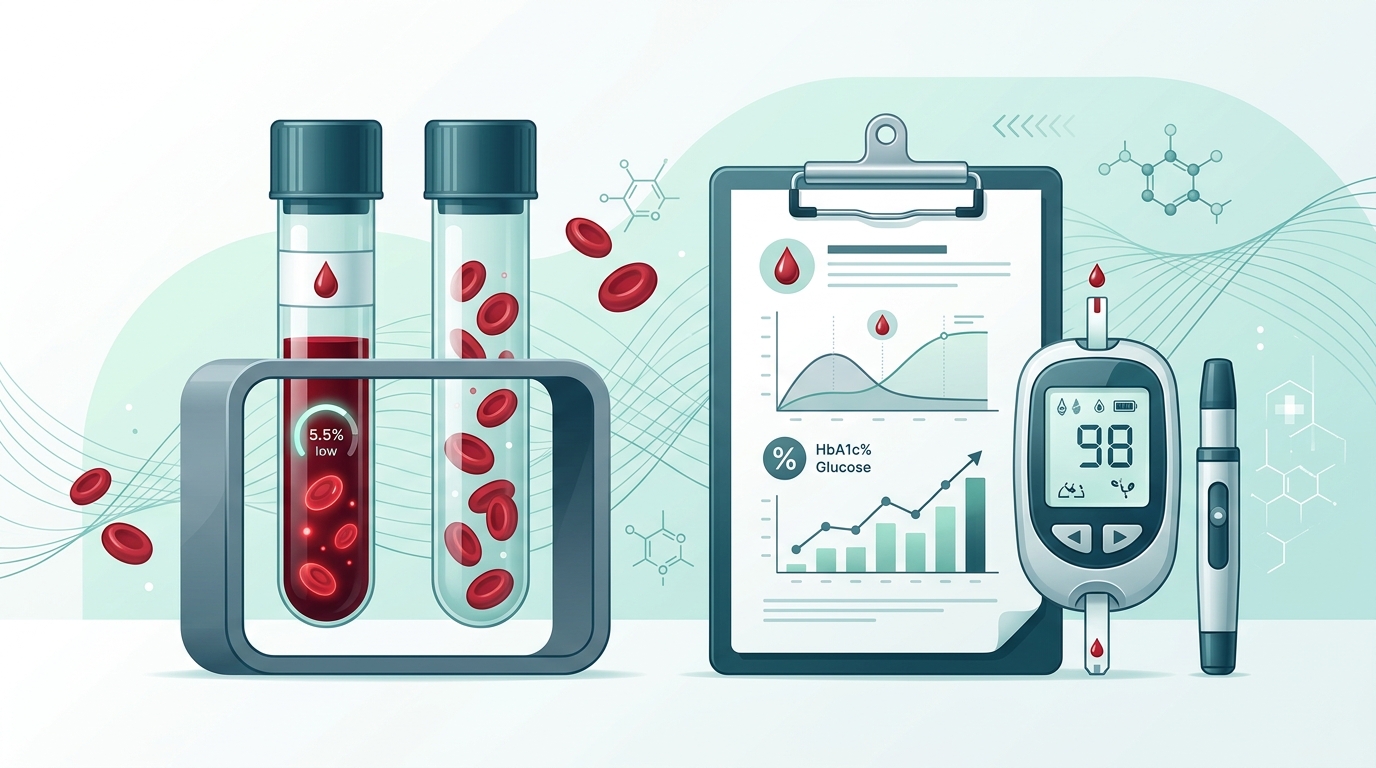
HbA1c to eAG Calculator
Convert your 3-month glycated hemoglobin into estimated average glucose.
Open tool →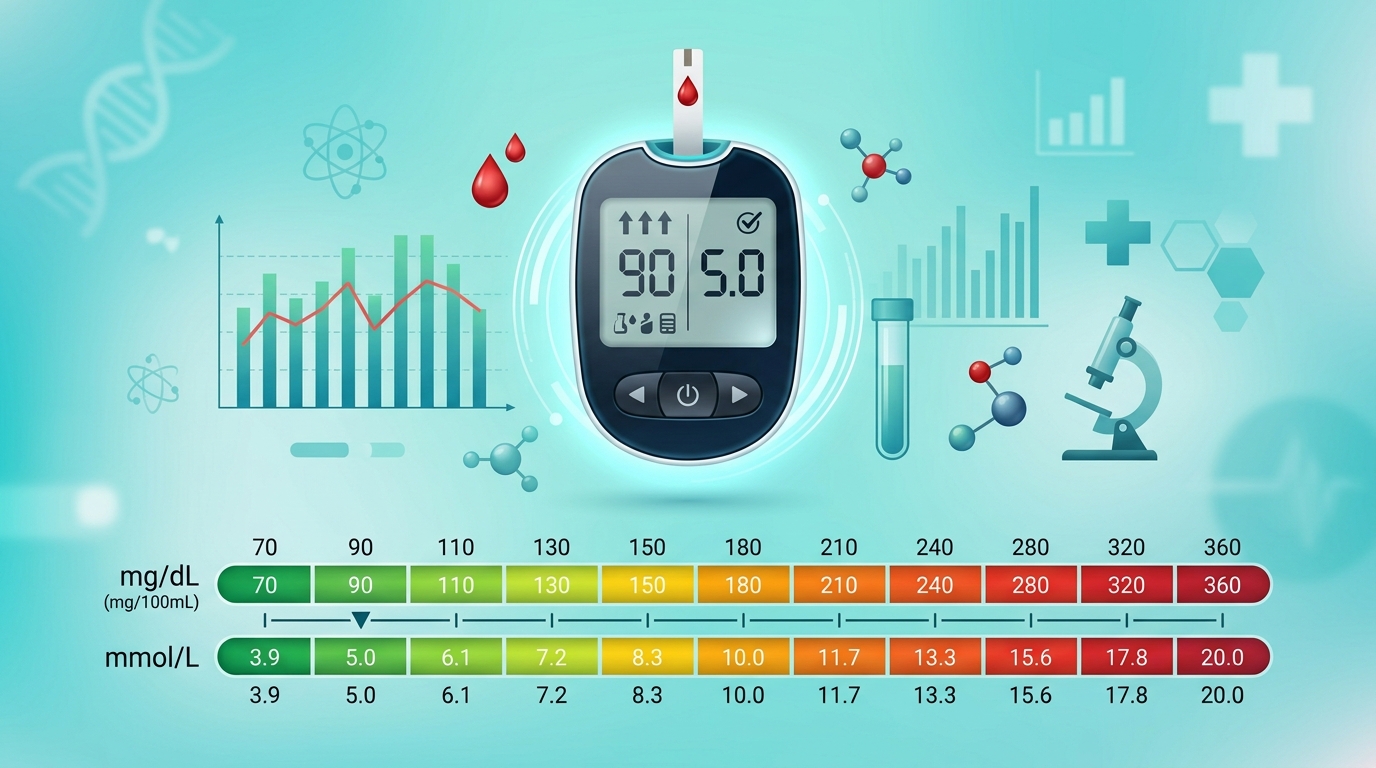
Blood Glucose Unit Converter
Instantly convert single blood sugar readings between mg/dL and mmol/L.
Open tool →Frequently Asked Questions (FAQ)
Track Your Daily Blood Sugar Patterns
Consistent daily logging before and after meals helps you and your physician identify food triggers and track metabolic improvement.
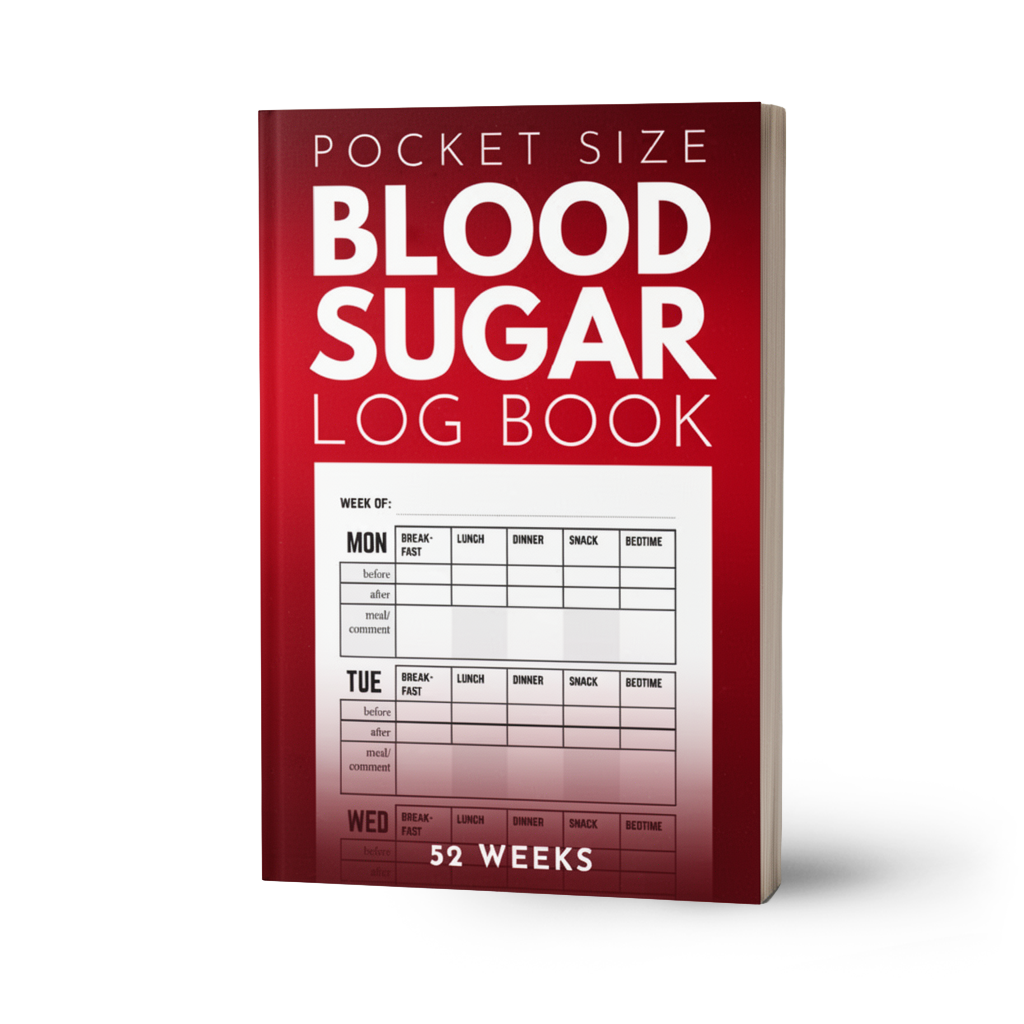
Overspire Pocket Blood Sugar Log Book
Designed specifically for tracking paired meal readings, medication dosages, and notes in a clear pocket format.
See on Amazon.com (4.5★)