Type 1 vs Type 2 Diabetes: Differences, Symptoms, Causes & Management
⚡ Quick 30-Second Answer
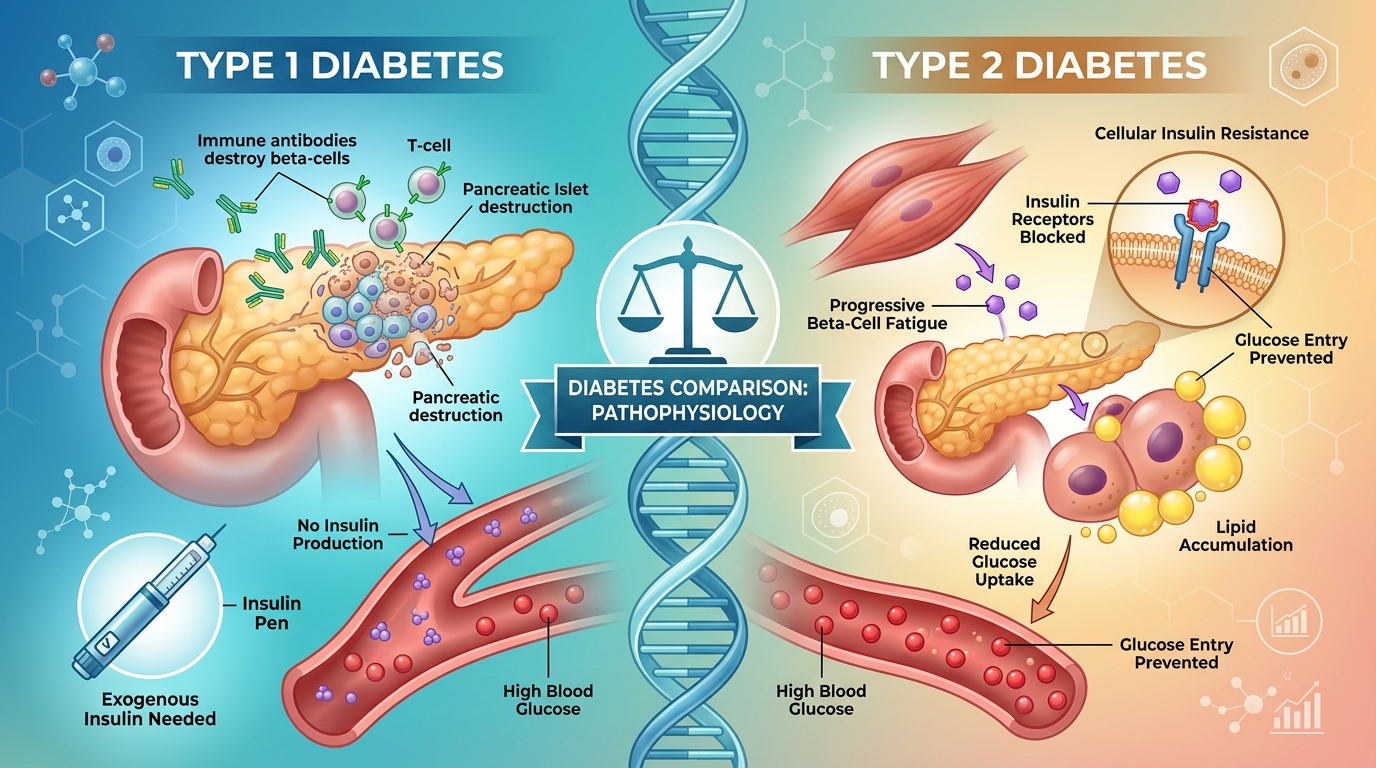
The core difference between Type 1 and Type 2 diabetes lies in the underlying pathophysiology: Type 1 is an autoimmune disease where the immune system destroys pancreatic beta cells, causing an absolute lack of insulin requiring lifelong daily insulin therapy. Type 2 is a progressive metabolic condition characterized by cellular insulin resistance (the pancreas makes insulin, but cells do not respond properly), strongly linked to lifestyle factors and often preventable or reversible in its early stages.
Clinical Comparison Table: Type 1 vs Type 2 Diabetes
Here is a side-by-side comparison of the key diagnostic and clinical characteristics:
| Clinical Parameter | Type 1 Diabetes (T1D) | Type 2 Diabetes (T2D) | Diagnostic Significance |
|---|---|---|---|
| Root Cause | Autoimmune destruction of beta cells | Cellular insulin resistance & lifestyle | Immune antibodies vs blocked receptors. |
| Insulin Production | Near zero / Absolute deficiency (Low C-peptide) | Initially high (Hyperinsulinemia), later declines | Absolute vs relative insulin deficiency. |
| Typical Age of Onset | Children, teens, young adults (< 30 years) | Adults (> 40 years, though rising in youth) | Rapid onset (weeks) vs silent (years). |
| Initial Symptoms | Rapid weight loss, extreme thirst, ketoacidosis (DKA) | Often symptomless for years, fatigue, blurred vision | Medical emergency vs incidental lab finding. |
| Primary Treatment | Exogenous insulin injections/pump required for life | Lifestyle, Metformin, GLP-1 agonists, oral agents, insulin | Hormone replacement vs metabolic sensitization. |
| Reversibility | Currently non-preventable and not reversible | Often reversible/remission achievable with diet and exercise | Autoimmune process vs lifestyle-driven. |
Assess your insulin resistance score
Curious whether your metabolism shows signs of early Type 2 insulin resistance? Calculate your HOMA-IR score instantly.
Open Free HOMA-IR Calculator →Biological Pathophysiology: What Happens Inside the Body?
In Type 1 Diabetes, autoreactive T-lymphocytes attack and destroy the insulin-producing beta cells in the pancreatic islets of Langerhans. Without insulin to unlock cells, glucose cannot enter tissues, leaving the body in severe cellular starvation despite dangerously high blood sugar levels.
In Type 2 Diabetes, the pancreas initially works overtime. However, muscle and liver cells overloaded with visceral lipids resist insulin signals. The pancreas pumps out 3x to 5x more insulin (compensatory hyperinsulinemia) until beta cells eventually suffer oxidative fatigue and fail.
Key Symptoms and Diagnostic Distinctions
The "4 Ts" of Type 1 Diabetes
Toilet (excess urination), Thirsty (unquenchable thirst), Tired (extreme fatigue), and Thinner (rapid unexplained weight loss), often culminating in Diabetic Ketoacidosis (DKA).
The Subtle Red Flags of Type 2 Diabetes
Post-meal brain fog, slow-healing skin cuts, recurrent yeast infections, tingling in feet, and darkening skin folds (Acanthosis Nigricans).
Genetic vs Environmental Contributions
Type 2 has a surprisingly stronger polygenic hereditary component than Type 1, but requires environmental triggers (diet, inactivity, visceral fat) to manifest.
Confirmatory Lab Tests (C-Peptide & Autoantibodies)
When diagnosis is unclear (e.g. LADA / 1.5 diabetes), doctors measure fasting C-peptide and autoantibodies (anti-GAD65, IA-2, ZnT8).
4 Pillars for Managing Both Forms of Diabetes
Structured Daily Blood Glucose Logging
Tracking pre- and post-meal numbers enables precise insulin dosing in Type 1 and isolates meal triggers in Type 2.
Nutritional Strategy (Carb Counting vs Low-Glycemic Whole Foods)
Type 1 requires matched insulin-to-carb ratios (Carb Counting); Type 2 benefits immensely from reduced glycemic load and high soluble fiber.
Physical Activity to Activate Non-Insulin GLUT4 Pathways
Resistance training and daily walking draw glucose directly into skeletal muscle fibers without demanding extra insulin.
Quarterly HbA1c Monitoring
Keeping 3-month glycated hemoglobin within individual targets (< 7.0% for most adults) prevents long-term micro- and macrovascular complications.
Related Clinical Tools
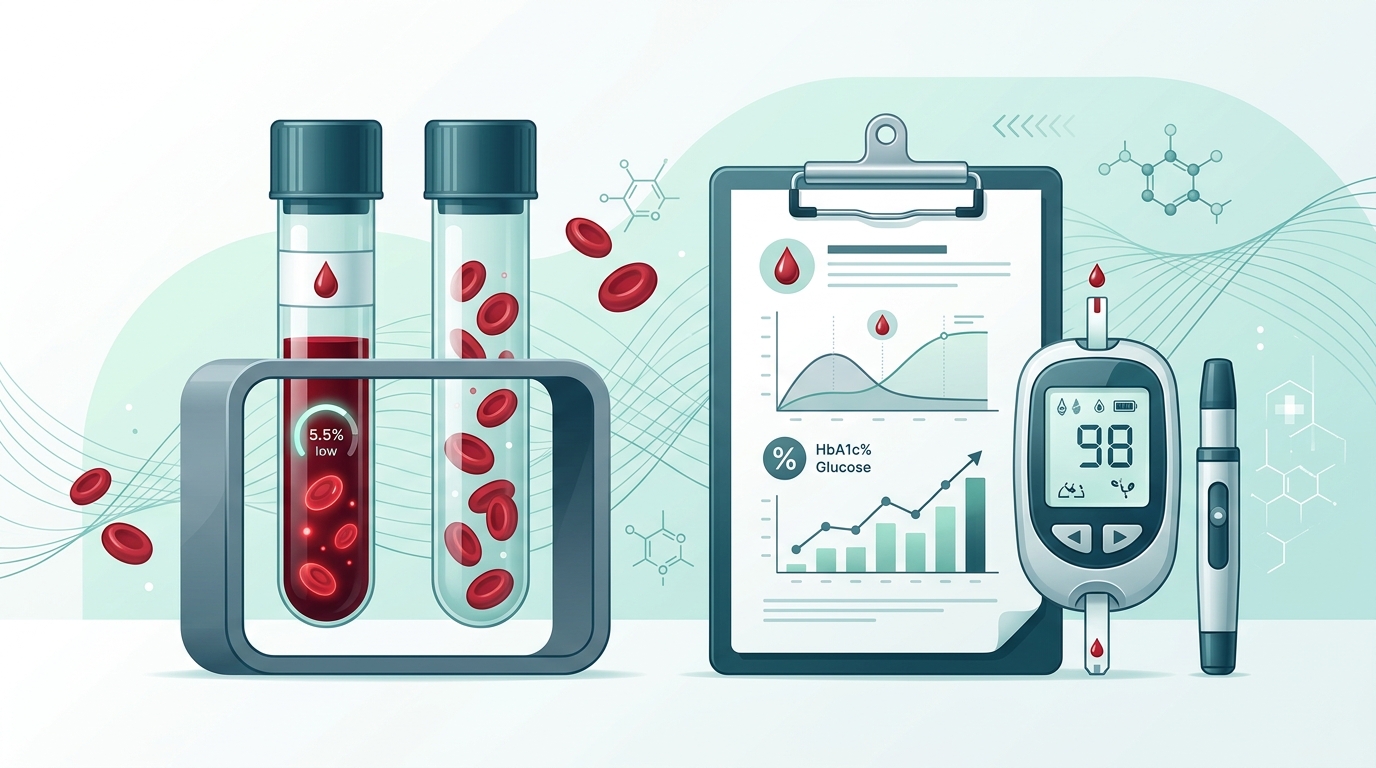
HbA1c to eAG Calculator
Convert your 3-month glycated hemoglobin to estimated daily average glucose.
Open tool →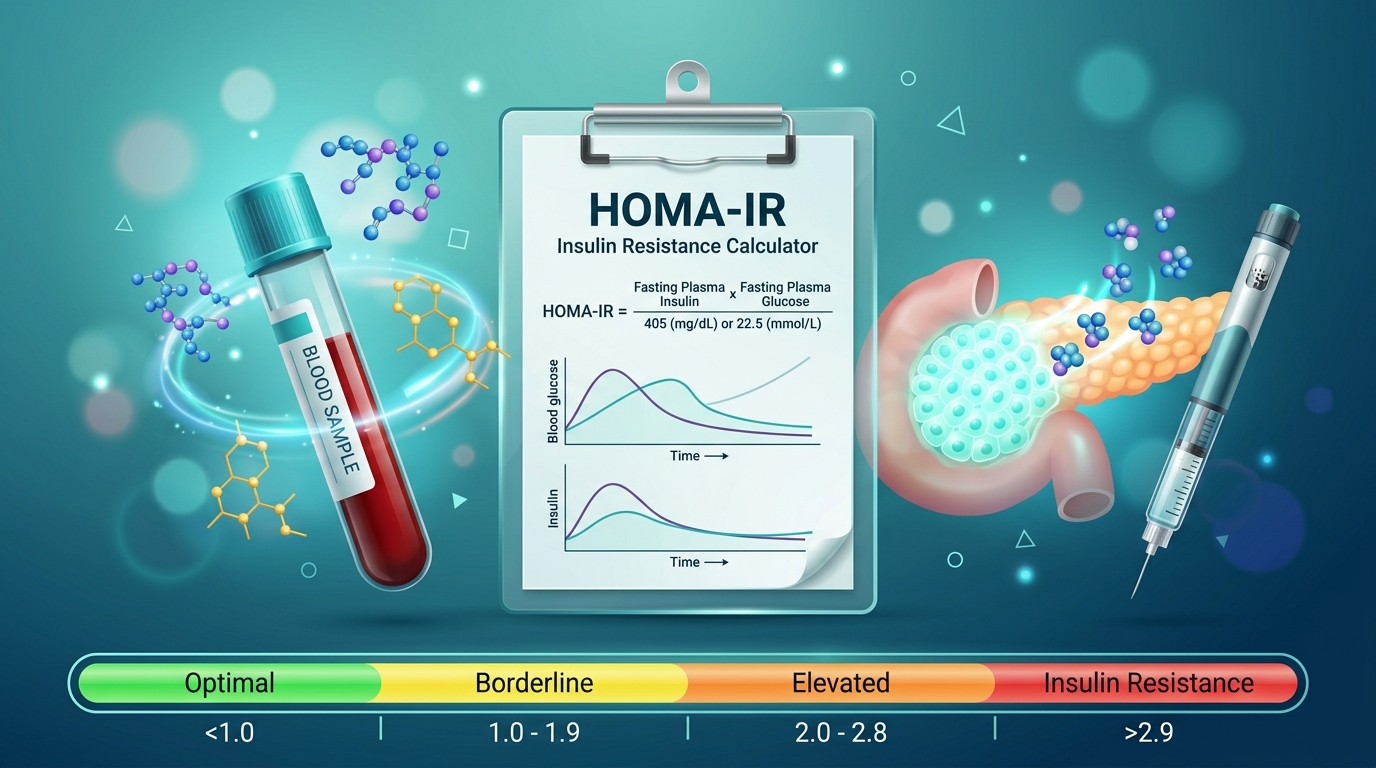
HOMA-IR Insulin Resistance Calculator
Evaluate your cellular insulin sensitivity from fasting blood tests.
Open tool →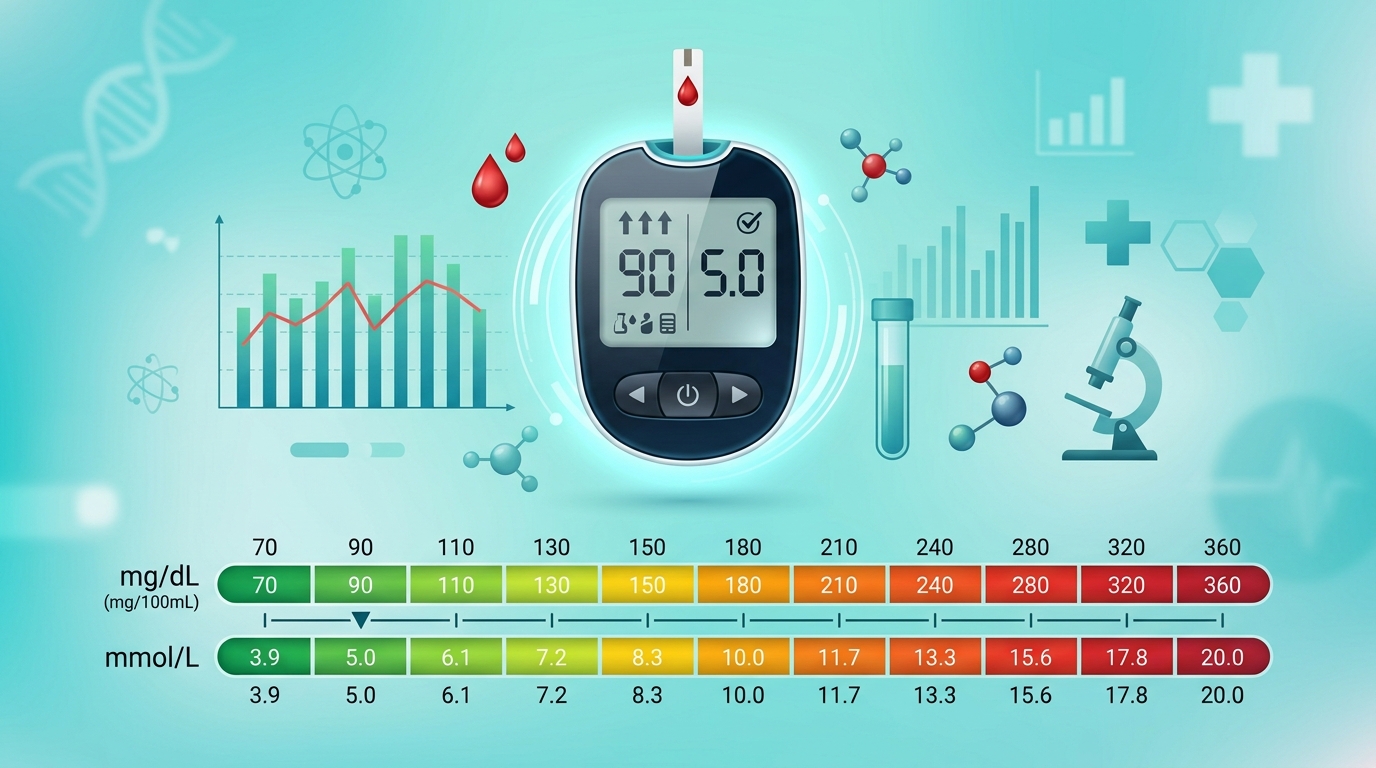
Blood Glucose Unit Converter
Quickly convert single glucose measurements between mg/dL and mmol/L.
Open tool →Frequently Asked Questions (FAQ)
Take Control of Your Daily Glucose
Whether managing Type 1 or Type 2, consistent daily logging is the cornerstone of vibrant metabolic health.

Overspire Pocket Blood Sugar Log Book
Tailored for tracking paired meal readings, insulin doses, medication, and lifestyle notes in a durable pocket format.
See on Amazon.com (4.5★)